Moronic Monday at the Finance subreddit
Could I build a simple predictive model
A new thread would be posted at the Finance sub every Monday as a platform for the wider community especially those who are new to ask questions related to finance such as financial careers, homework problems or even finance in general. Most of the questions have been asked numerous times and could be easily answered using Google.
Despite the general questions, the members are still helpful and they do their best to help the newcomers by providing lengthy and in-depth answers. Here, I attempted to analyse the responses to extract some useful data.
Data collection
The data were collected using the PRAW API and it contained comments in the weekly Moronic Monday threads from 10 Nov 2014 to 18 Jul 2020. With that, I have gathered a total of 15,734 comments out of the 296 threads.
How lengthy are the comments?
As mentioned earlier, the members are generally helpful and tried their best to provide a detailed responses. But how long are their responses? Before I begun the analysis, I would have to preprocessed the data by removing any deleted or removed comments as well as comments with no content such as an emoji response. All URLs are replaced with the term “URL” to ease the preprocessing. All quoted comments were removed.
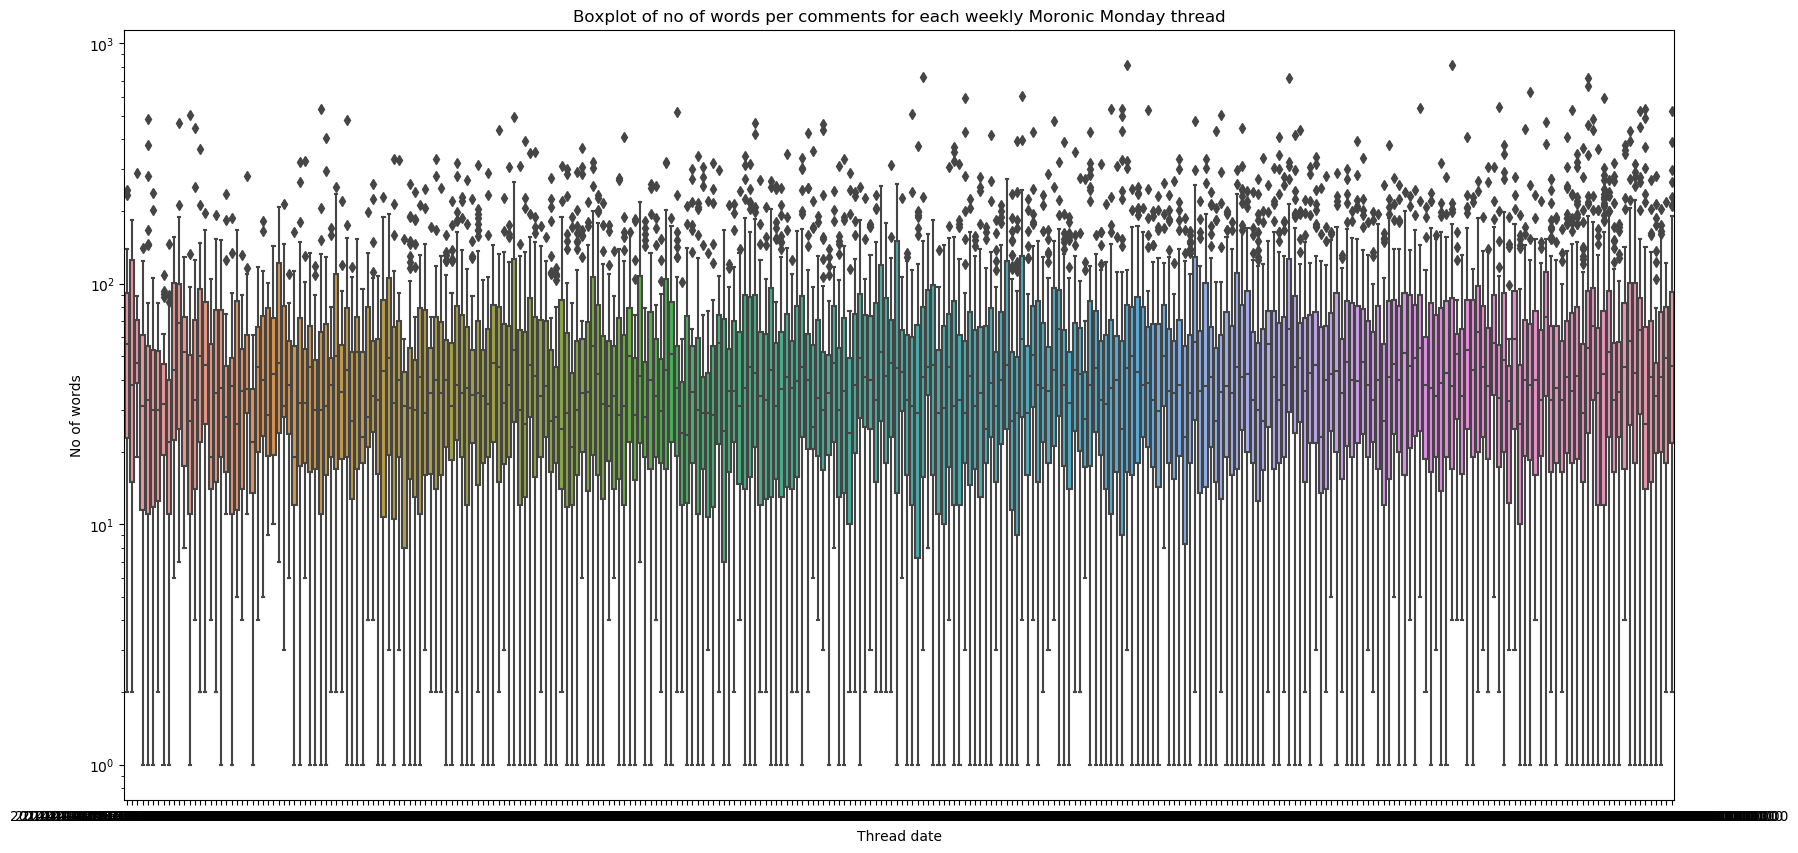
Above is the distribution of number of words for each weekly thread. The y-axis is plotted on a log scale so that the illustrated boxplot is not skewed to the lower range. The number of words for each comment doesn’t change much throughout the years as each comment is typically 120 words or less. However, there were still a number of comments in each weekly thread that were considered as outliers in the box plot. These comments are the comments that are more in depth as the members took the time and effort to put things into perspective for the reader to better understand.
What are the typically discussed in the weekly thread?
All stop words as well as URLs and emails were removed from the comments. The top 150 bigram and trigrams from the comments were then plotted in a word cloud as shown below:
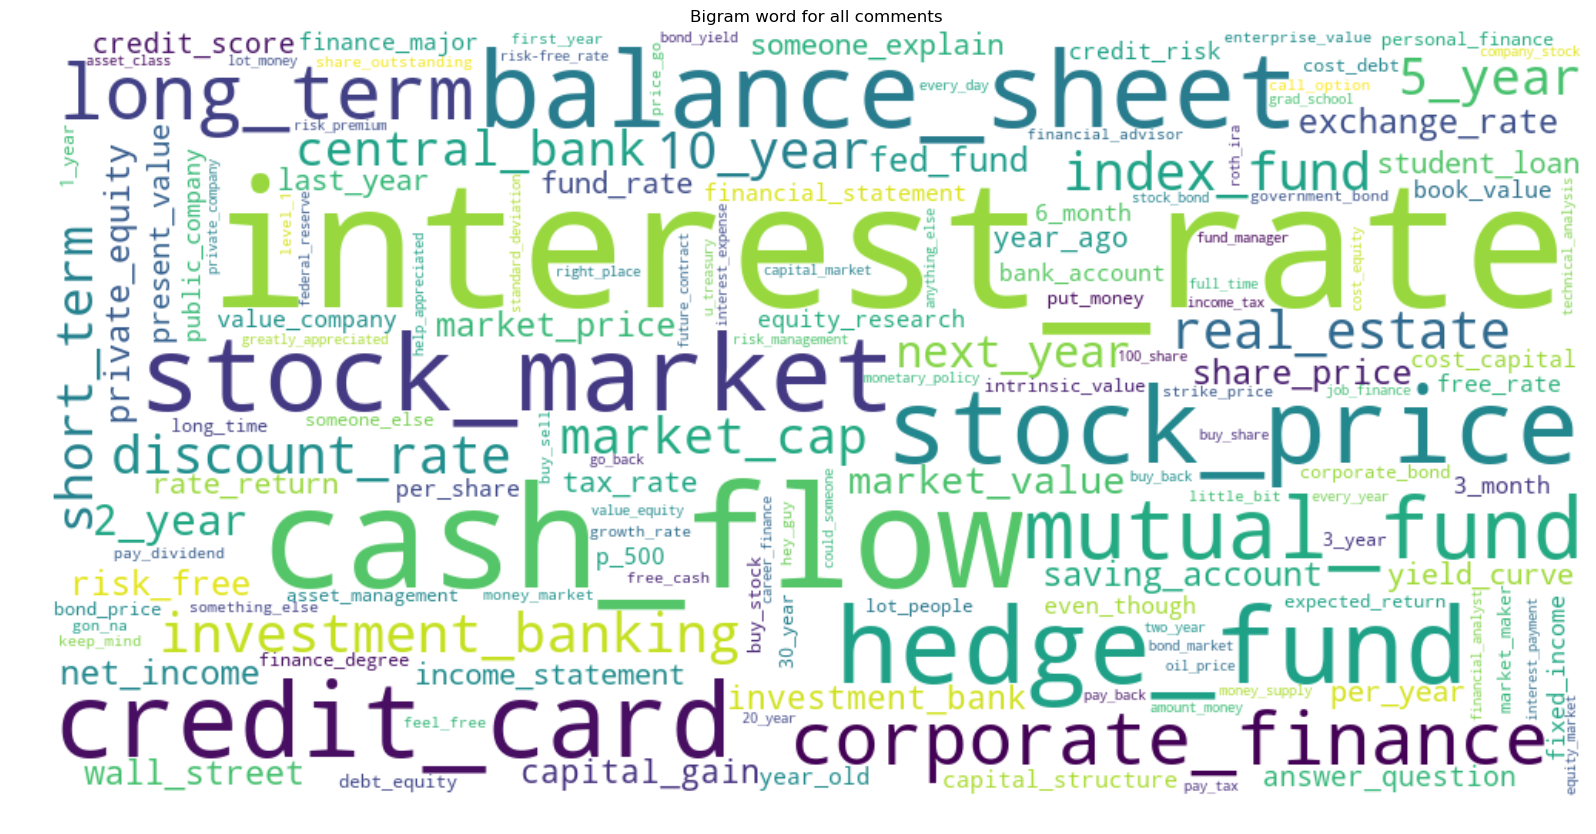
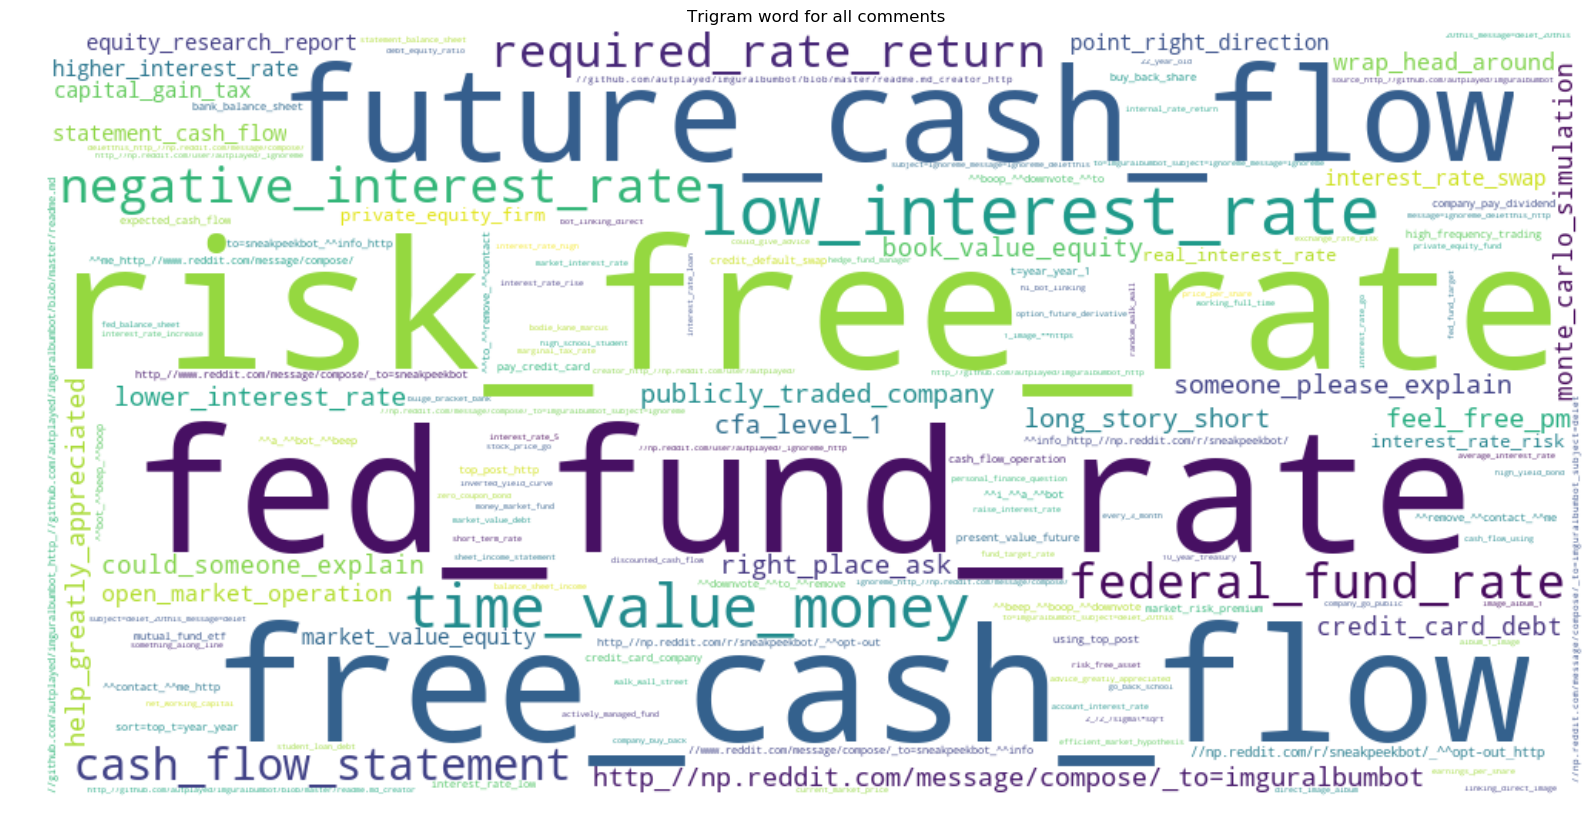
There is nothing surprising here. Most of the terms used are related to finance. In the bigram word cloud, the font size of the different terms are about the same, which indicates that these frequently used terms are used at approximately the same frequency. However, when we look at the trigram, we can see that only a few 3-words terms are frequently used, which are future/free cash flow and some sort of rates such as the risk free rate and federal fund rate.
Based on these two word clouds, we could conclude that the discussions often revolves around the impact of cash flow and rates on investment such as stock price and stock market. Not to mention, there is a huge emphasis on time value of money. I guess that that huge emphasis is necessary since anyone that asks a question here is often new to finance topic.
1. Can I predict next week’s total comment counts?
First thing that I’d like to know is the total number of comments in each weekly thread. So, here I have counted and plotted a figure to illustrate the number of comments since 2014.
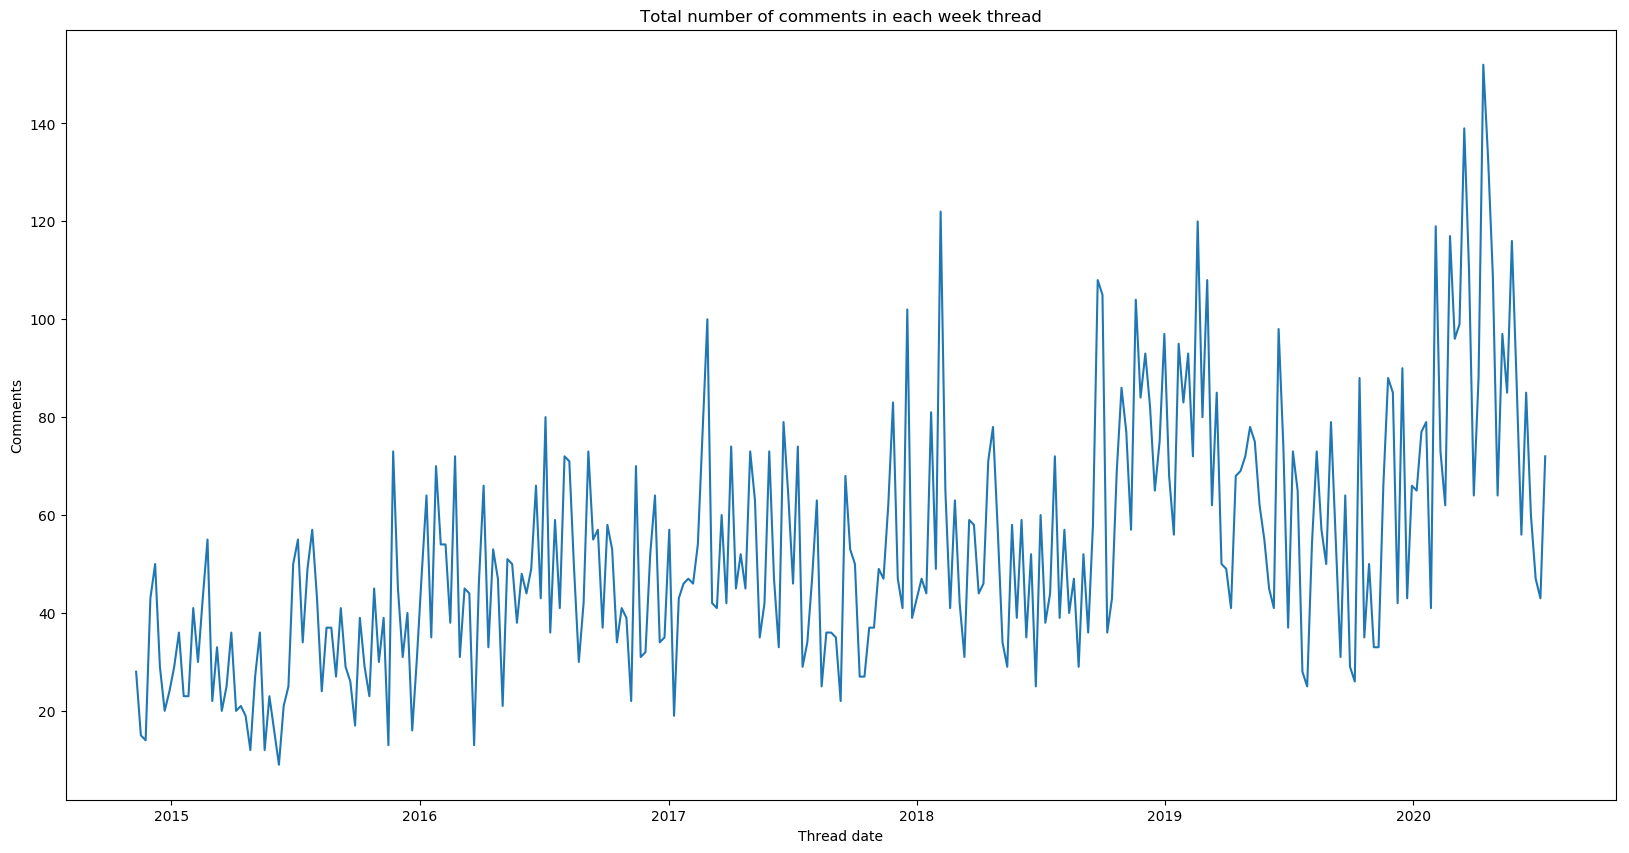
Two things that you can notice:
- There is an obvious upward trend. So it is not a stationary time series data.
- There is some seasonality pattern to it. The number of comments would peak sometime after the year start then it would go downwards before picking up again in the last quarter of the year.
This would be a good time to dig out my time series knowledge and implement an ARIMA model on this short time series data. I split the small dataset into training set (from 10 Nov 2014 to 31 Dec 2017) and test set (1 Jan 2018 to 18 Jul 2020). I first determined the suitable set of parameters for my ARIMA model based on the training set, which I found to be (3,1,1). This set of parameter yields the lowest AIC score of 1375.784.
I then developed an ARIMA model on a rolling basis assuming that the set of parameter remains valid. What this means is that for next prediction, I refit my ARIMA model based on the most recent n data points, in this case, n = 164. The prediction made and the 95% confidence interval as well as the actual no of comments are plotted in the figure below. The ARIMA model works well as it is able to capture the seasonality trend and most of the actual no of comments are well within the confidence interval. Not to mention, a small dataset is more than sufficient to predict the next week’s no of comments, which keeps the training time short.
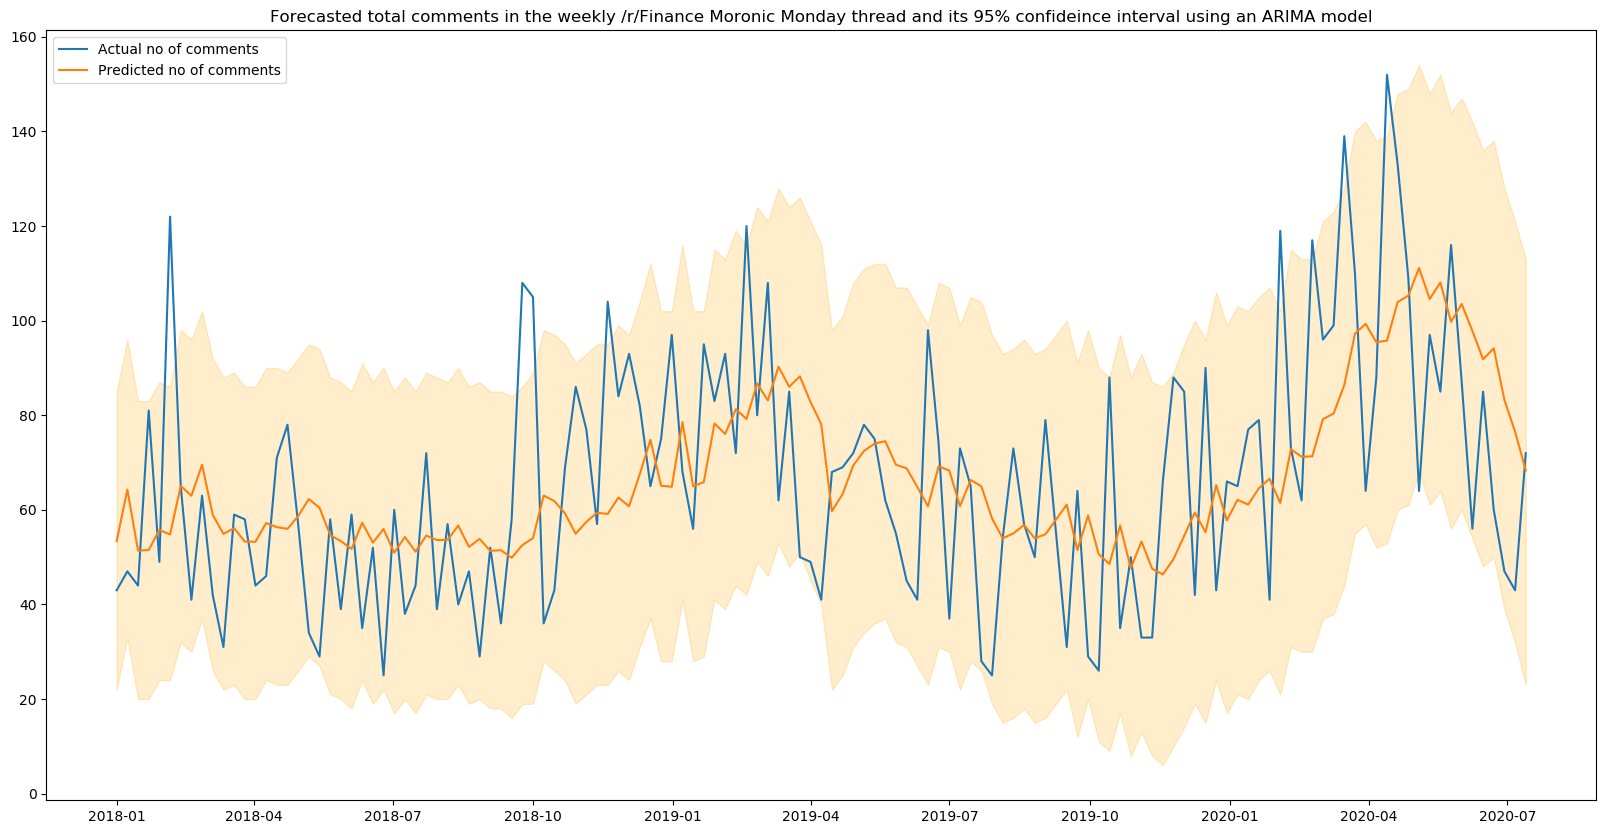
However, it should be noted the confidence interval is rather large as the standard deviation is about 35. Since this is a finance thread for Reddit users to ask questions, they could be asking questions related to recent actions taken by some financial institutions or the impacts of some regional or global events such as the ongoing Covid-19 pandemic. A more accurate model could be built if such information can be incorporated.
4. How many votes are given to each comment?
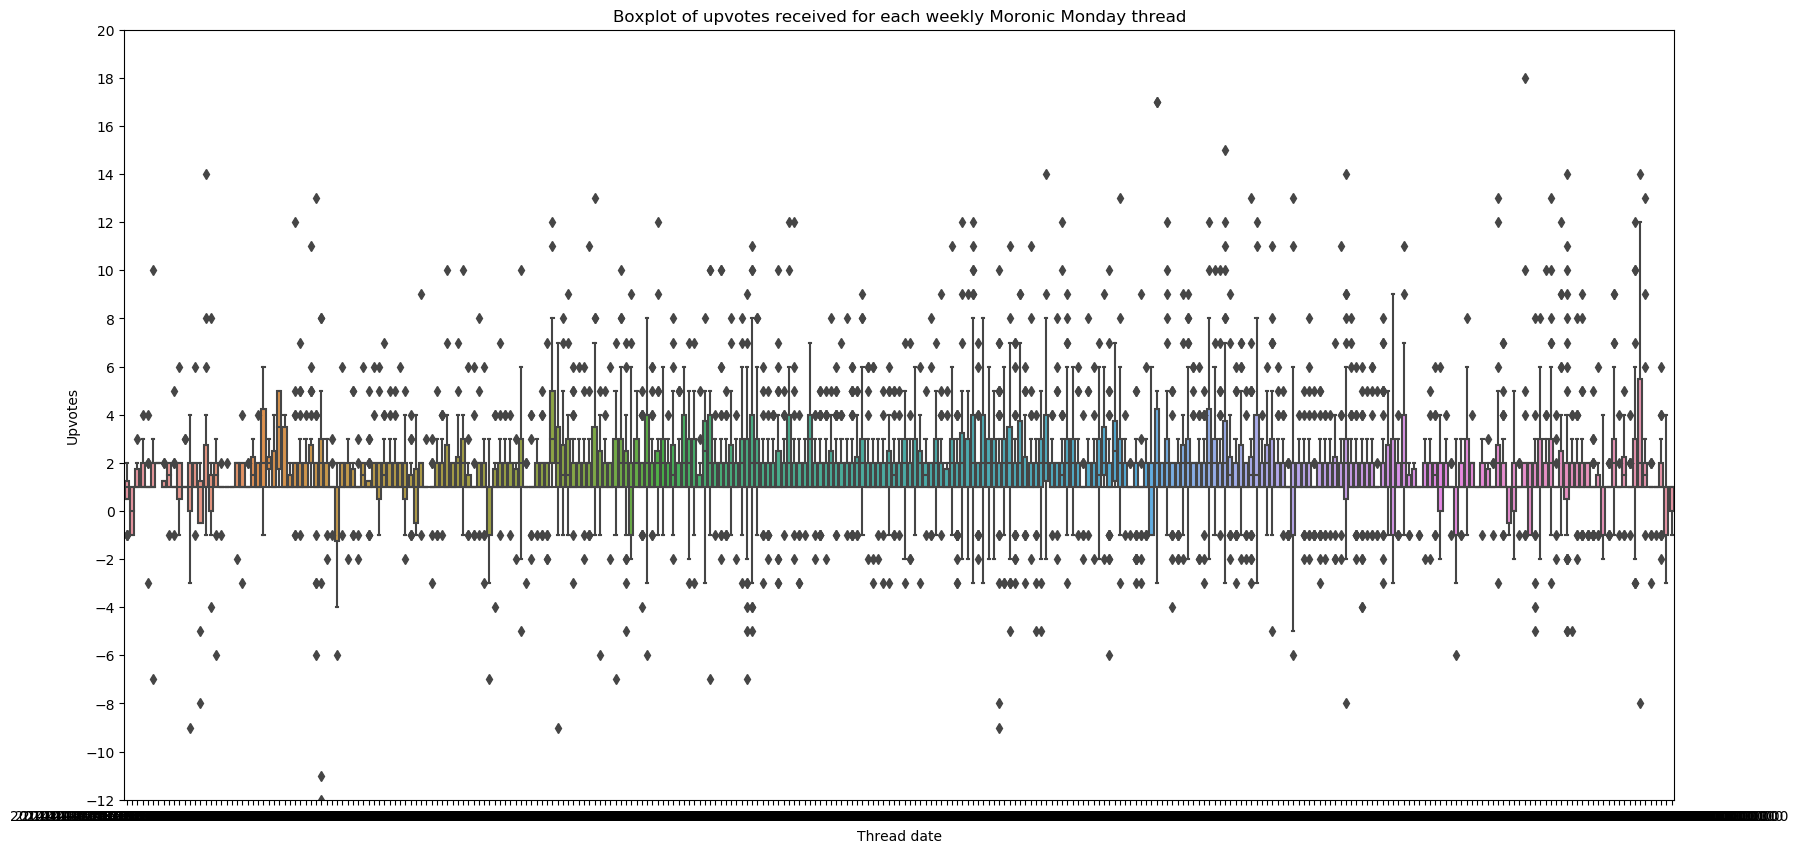
Here, I plotted a boxplot for each weekly thread to illustrate the distribution of upvotes. I excluded comments with 0 vote because a posted comment would come with 0 upvote by default. Of course there would be possibility that the net upvote is equal to 0 but I’d assume that that probability is very low.
It’s quite clear that a typical comment in the Moronic Monday would often receive upvotes than downvotes. People would typically give an upvote if they agree with the stated comment or on the same page as the poster. You can see that it’s typically 1 to 3 people who upvotes a comment.
If a comment were to receive a downvote, it would typically receive 1 or 2 downvotes. As the number of downvotes increase, the frequency decreases. Considering that this is a weekly thread pinned to allow the community to ask questions, no matter how stupid it may be, the community in generally are fine with the questions and are more than glad to see such question posted in here than as a whole new thread.
5. What are the typical terms used in the comments with net upvotes and downvotes?
Likewise, I plotted the bigram and trigram word cloud for the comments with a net upvotes and downvotes respectively. I observed that there are hardly any difference in the terms used for the comments with net upvotes and the terms in the word clouds in Section 3. So I would not be showing the figures for it. Instead, I would show the figures for the comments with net downvotes.
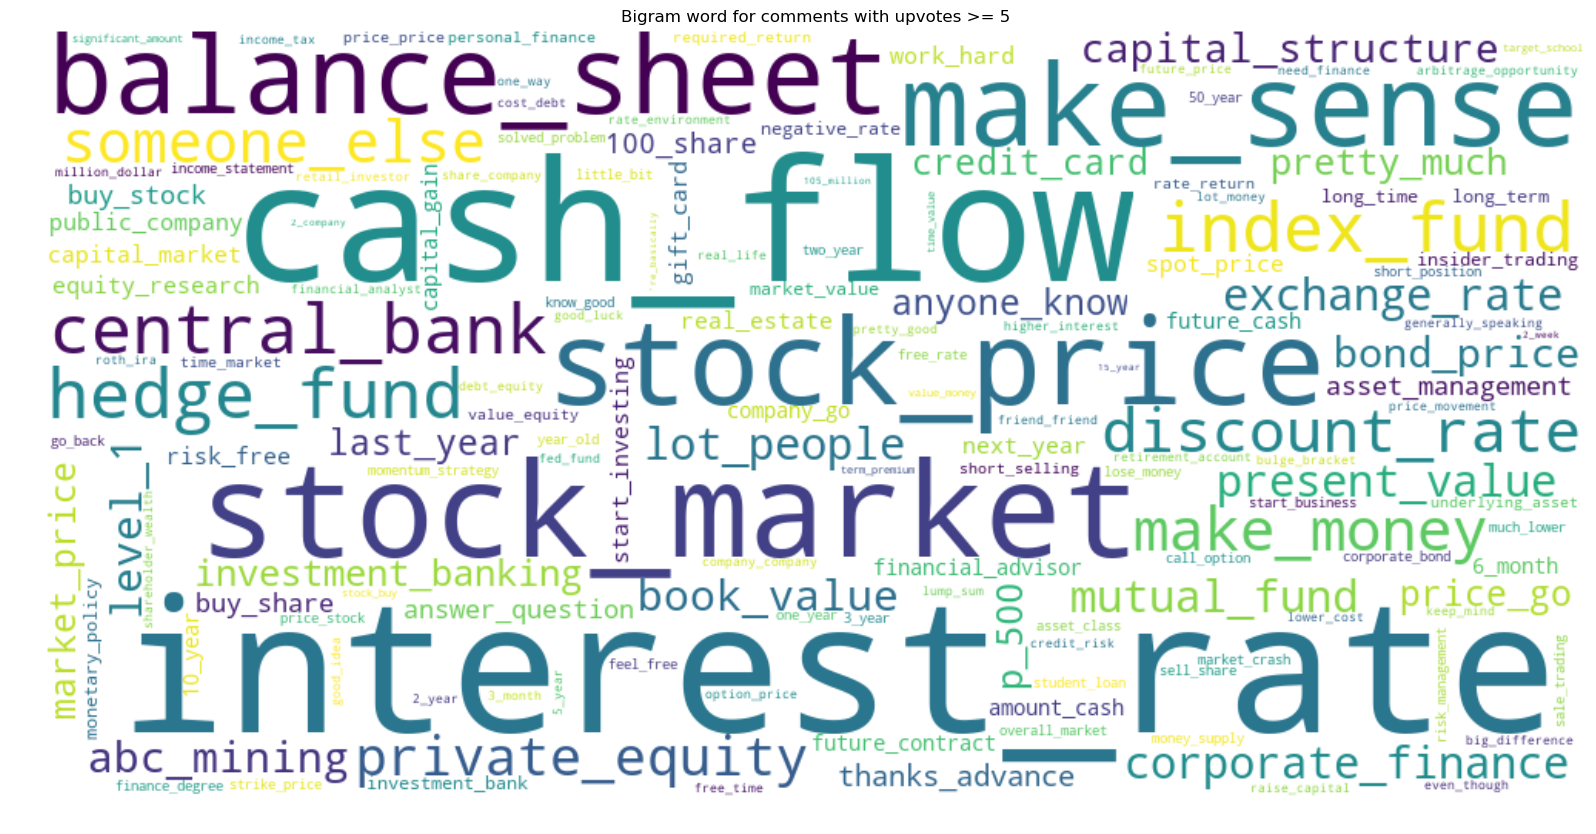
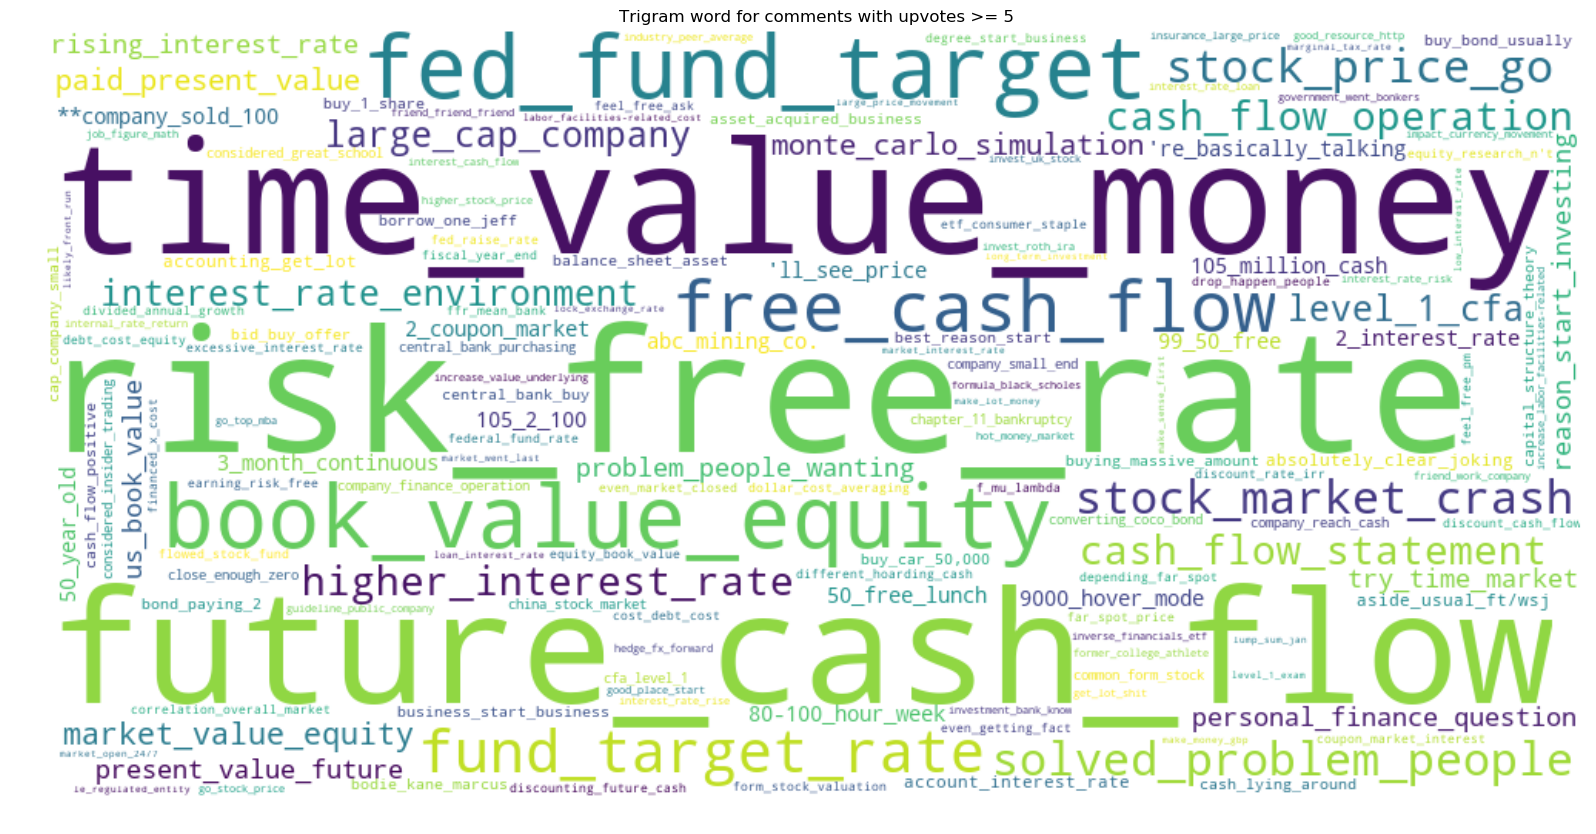

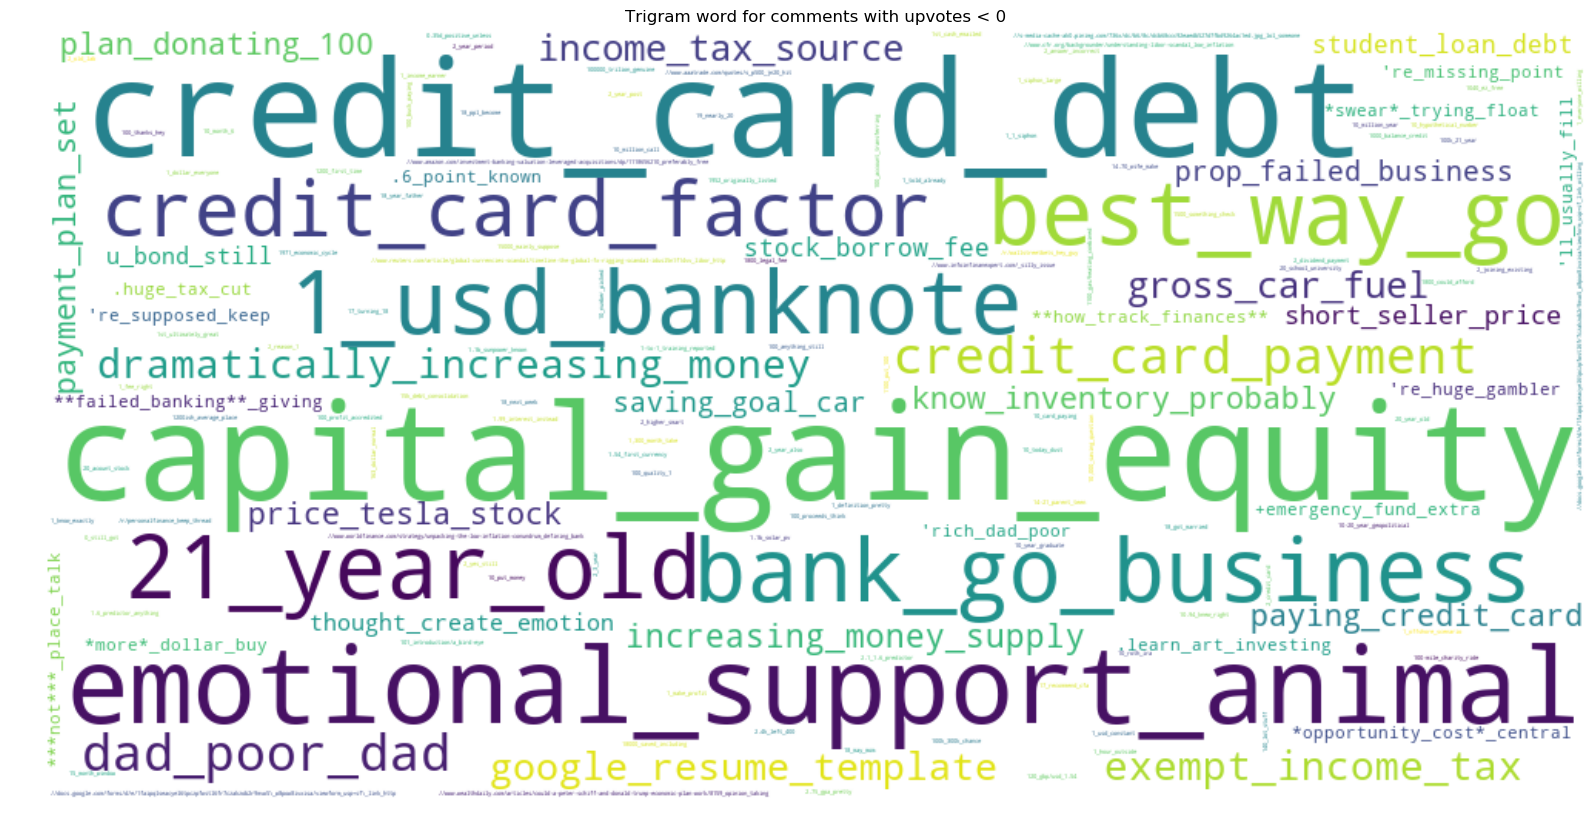
Above are the bigram and trigram figures for comments with at least 1 downvote. One can get a general sense that the finance community is not in favour of discussions about one’s personal finance management such as credit score or credit card debt, or attempting to make fast money by risky investment such as short selling. These are very much in line with the sub’s purpose, which is to discuss about the multiple facets of corporate and advanced finance but not about financial advice and risky statements.
6. Can I predict whether a comment would receive a net upvotes, a net downvotes or none at all?
Here, I would attempt to classify a comment as in one of three classes: 1) comment with a net upvotes, 2) comment with a net downvotes, and 3) comment with no net vote based on what is written within the comment itself.
I first split the data into training set and test set. The training set contains all comments that were posted before 2020 and the test set contains all the comments that were posted in 2020. Using the training set, I then extracted the top 2000 most frequently used words as my features.
Based on the top 2000 most frequently used words, I trained a Naive Bayes classifier (NB classifier) and then predicted the class for each of the comment in my test set. The accuracy score for the training set and test set are 50.7% and 47.9% respectively, which is better than randomly classifying with a 33% chance of classifying correct.
Based on this simple exercise, one can conclude two things:
- The most frequently used words did not change significantly over time. If the most frequently used words did change with time, the performance of the NB classifier on the test set would be very different from that of the training set.
- Considering that accuracy scores on the training and test set are moderate, there are more features that could be considered by the NB classifier such as the time and date of the posted comment and the sentiment of the community at the time.
Conclusion
There is an seasonality trend of the number of comments in each weekly Moronic Monday thread, which can be captured by a simple ARIMA model. Despite that, there is a large deviation in the predicted versus actual number of comments as indicated by the large standard deviation. Most of the comments are not particularly lengthy as the number of words per comment is typically 120 words or less, excluding any quotes that a user may have used. By analysing all of the comments, we can see that the community typically discuss about cash flow and some sort of rates such as the interest rate, risk free rate and federal fund rate and these can have impact on the stock market and stock prices.
In Reddit, each comment can be given an upvote or downvote by a user. So I trained a simple Naive Bayes classifier to predict whether would a comment receive a net upvotes, downvotes or zero net votes. The trained NB classifier managed to predict with almost 50% accuracy on an unseen test set, which is comparably better than randomly guessing with 33% chance.