SGReddit analysis
This descriptive project revolves around SGReddit daily threads. The primary python packages used are PRAW API and pandas. The data covers from 24 Jun 2014 to 2 Jun 2020, which gives me a total of 2166 threads. 7 threads were missing and couldn’t be found on SGReddit despite the manual search. The information that I scraped were:
- content of the comment
- username of the comment
- time of comment submission
- votes of the comment
The data were then collated into a large master csv file though there must be better and more efficient way to store and read these data (perhaps json?). Anyway, this is my first attempt at a proper data analysis work. Hopefully I do it some justice and gain some insights.
Although I’ve only collected 4 information, these information can be used to answer a number of things.
How has the community of SGReddit grown over the years?
First thing I want to know is how has the community grown over the years, even before I joined Reddit. One way to track and estimate the growth of the community is to determine the number of daily unique users for the daily thread. No doubt that the same person may have created multiple accounts such as a throwaway account and make a comment on the daily thread but based on my experience, I don’t see many throwaway accounts. So this should be a good representation of the community growth.
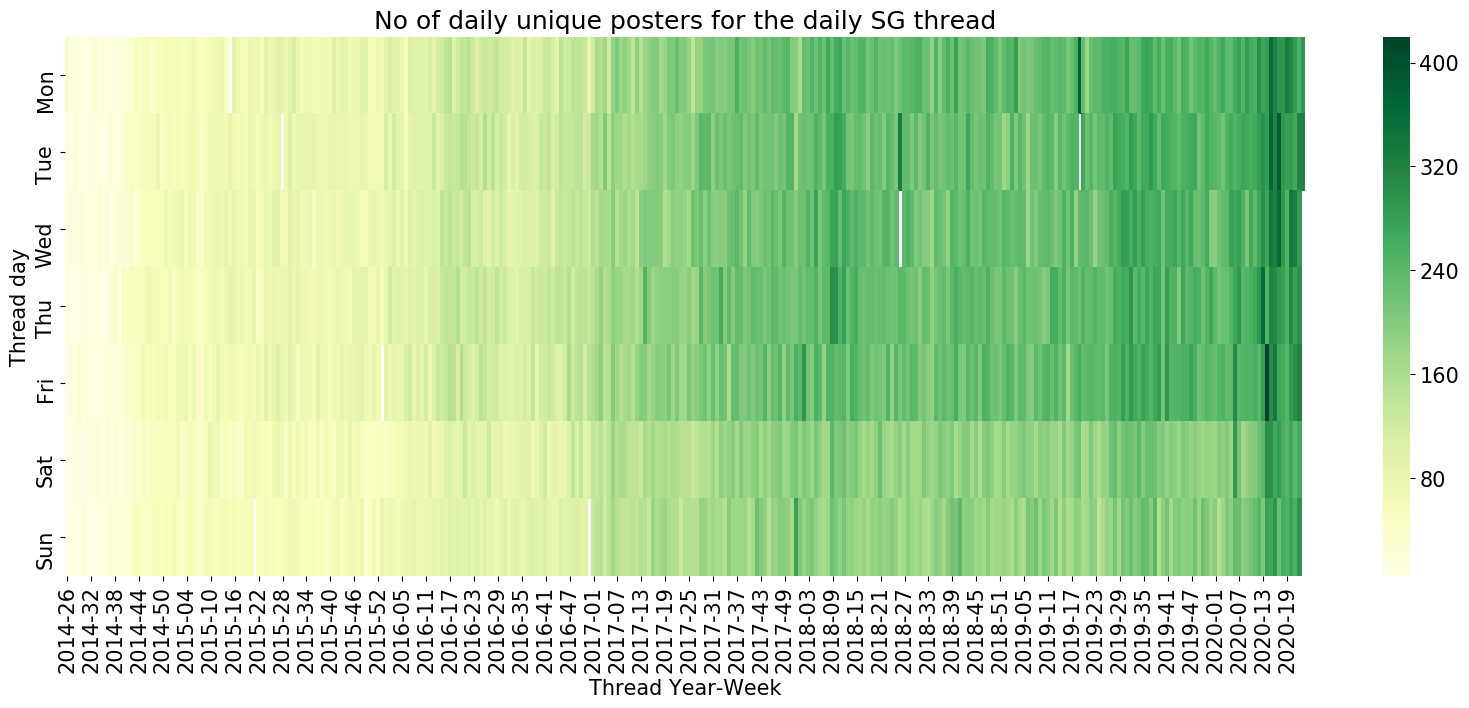
Despite the missing data, you can clearly observe a few things:
- The number of unique posters increases across the years for any given day of the week as indicated by the increased intensity of the colour.
- There is a clear distinction in the number of unique posters before 2017 and 2017 onwards, as indicated by the lighter vs darker green. This may be when Reddit really kicked off in Singapore and garnered more users.
- There is also a clear distinction in the number of unique posters in the weekdays vs the weekends across the years. A possible explanation is that more redditors would be online on weekdays due to reasons such as being at work, whereas redditors would be enjoying their lives on the weekends such as going out to the shopping malls or exercising.
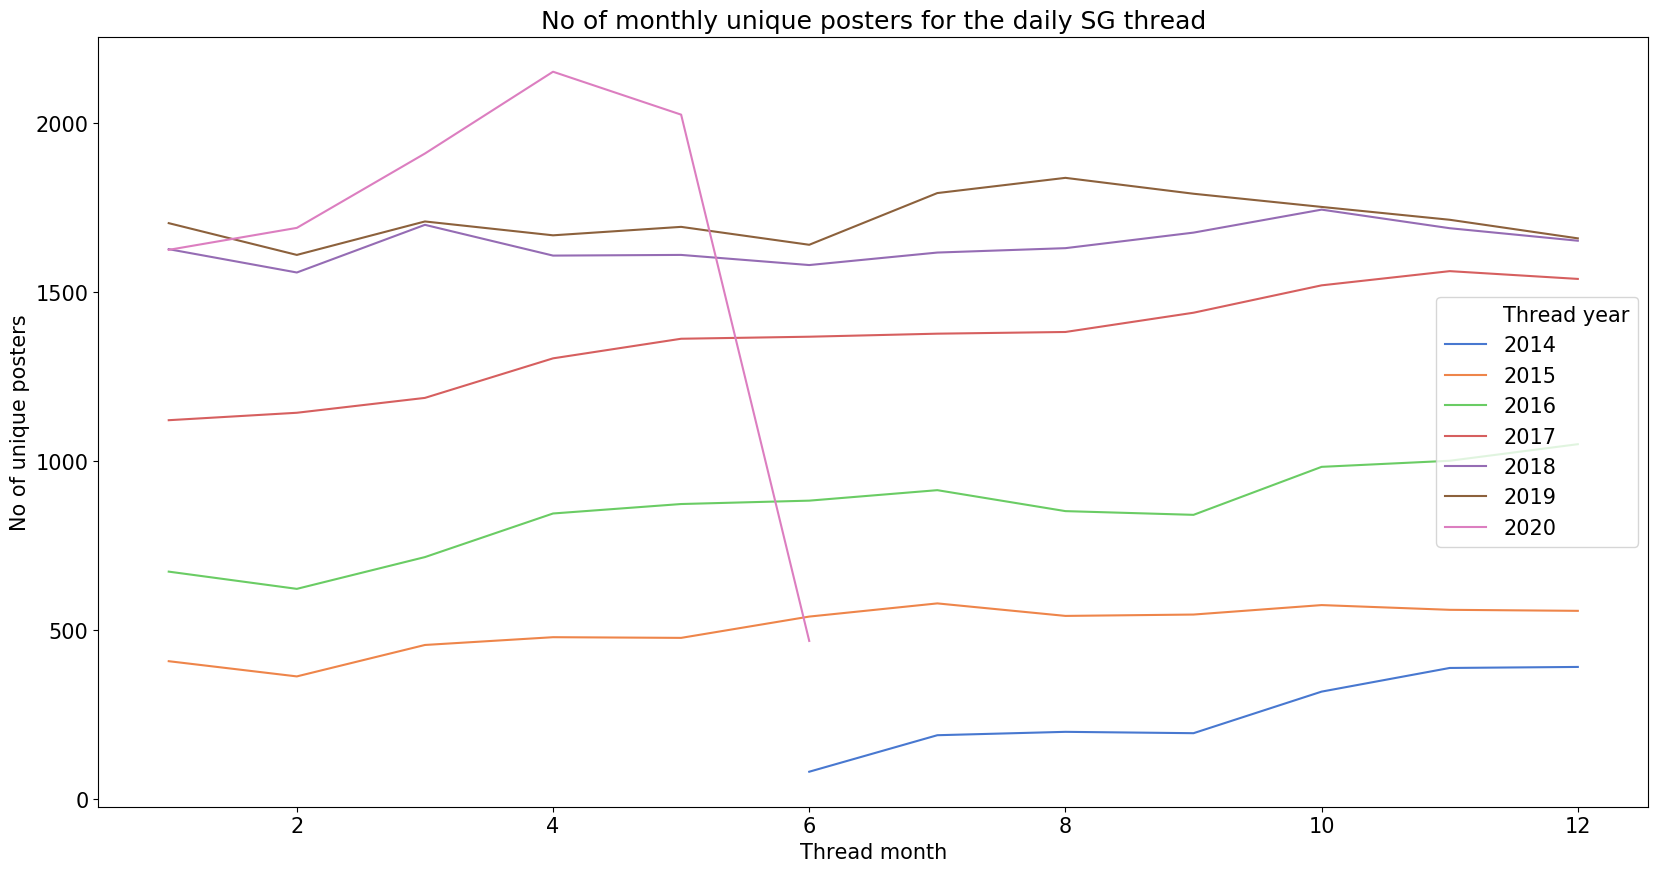
Based on this figure, you may make a few observations:
- The monthly total unique posters keeps increasing from Jun 2014 to Dec 2017. Thereafter, the monthly total unique posters hovers between 1600 to 1800 and hasn’t changed since.
- There is a spike starting Mar 2020. This is due to the Covid-19 pandemic which triggered lockdowns across the world including Singapore. Employees are forced to work from home and have litte incentives to leave the house given the restrictions.
How has the number of comments grown over the years?
Since there is evidence that the community is growing, how about the number of submitted comments? Are the community becoming more engaged and chattier?
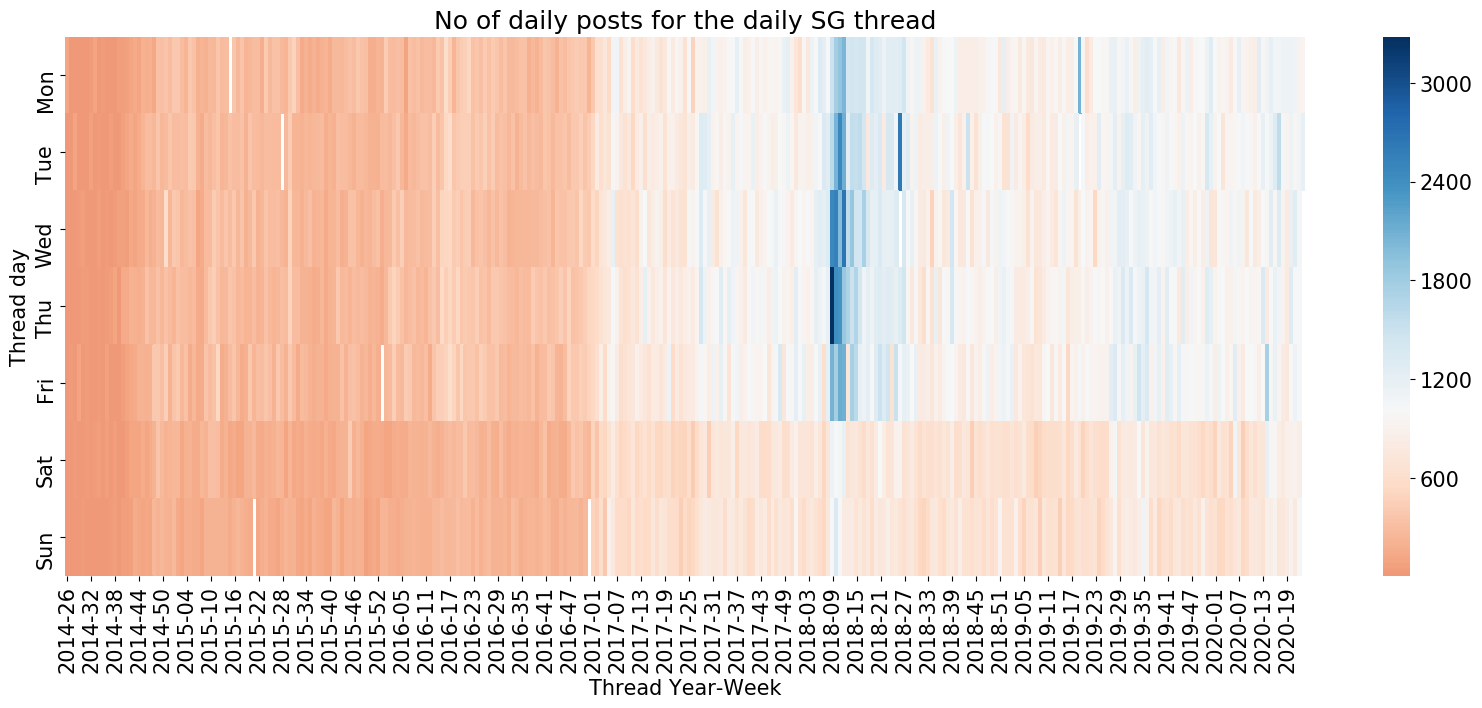
Based on the figure above, you can make the following observations:
- The number of posts progressed from ~50 posts to about 1000 posts a day. There is a very clear separation at the start of 2017 where the number of posts hover around 1000 posts a day.
- There is an abnormality in 2018 where there were 2000 posts or more for approximately 4 weeks.
- The number of posts on the weekdays vs the weekend is still vastly different where there are usually 1000 and 600 posts on weekdays and weekends respectively. This can be explained simply because of the reduced number of unique users on the weekends, and hence, reduced engagement.
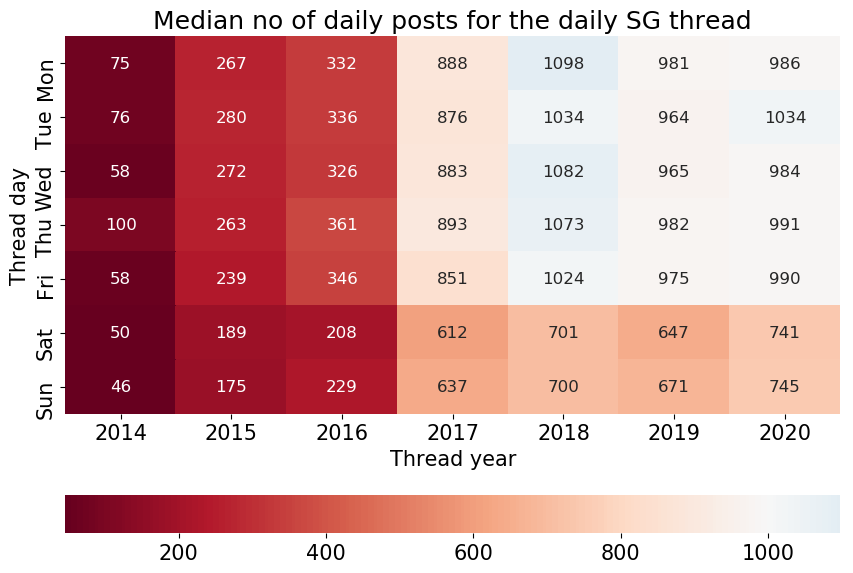
We can take a look from a different perspective by plotting the median number of posts for each day of the week by year. The values for first 3 years (2014 to 2016) should be taken with a pinch of salt as the number of comments back then was still experiencing growth and hasn’t reached its stationary stage yet. So simply taking a median value for then period is like taking the mid point of an ever increasing growth.
By making such plot, we can observe the following:
- The median value of each day has been rather consistent since 2017.
- The data for 2018 is the highest simply because of the outliers in early 2018 as mentioned previously.
- Looking at the data for 2020, the median number of posts is still about the same value as the previous year despite the implemented circuit breaker. Could this mean that the number of posts per user has dropped?
Have the users been posting more?
I calculated the average comments per user by dividing the total comments by the total unique users for each day. Then, I plotted another heatmap to illustrate the average number of comments per user since 2014, as shown below.
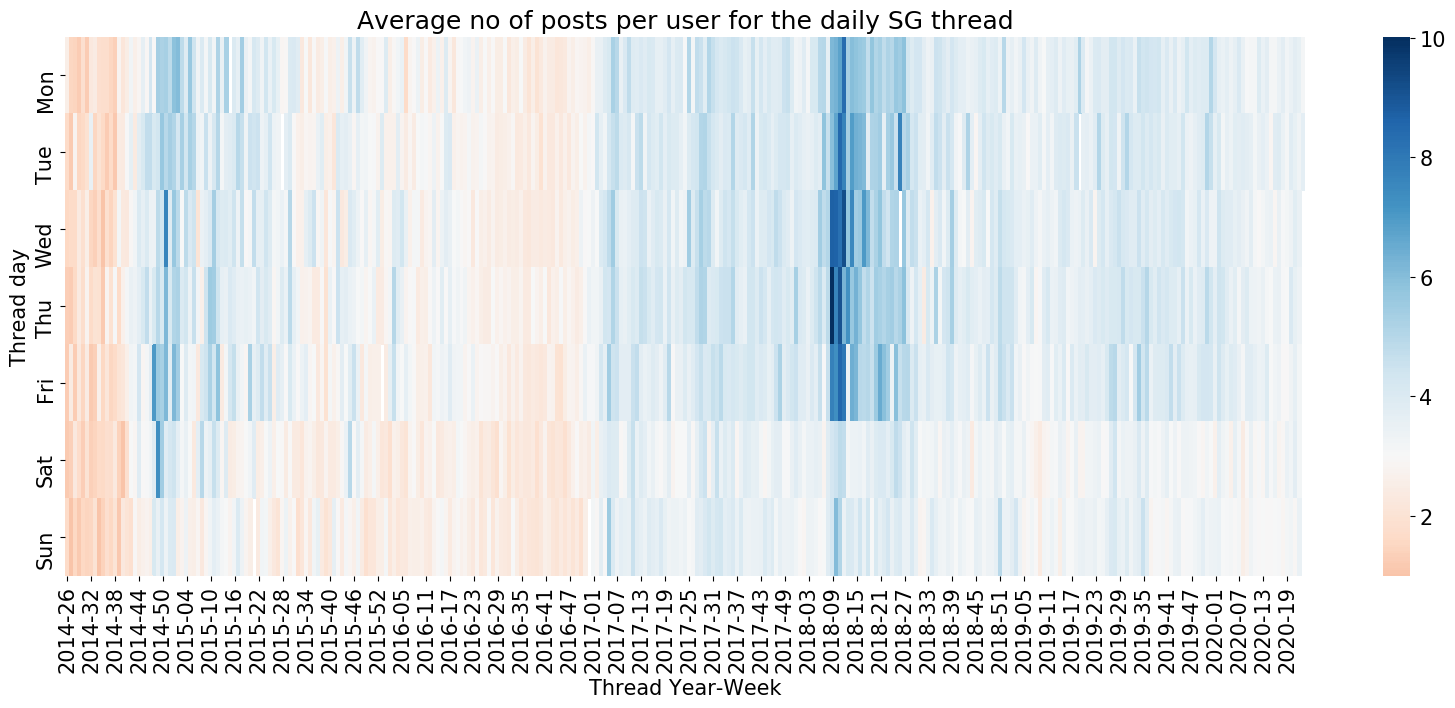
Based on the figure above,
- The average number of posts per user back then was about 2 to 3 posts and it has grow up to 3 to 4 posts in recent time. Occasionally the number of posts per user does go up to 5 and beyond.
- You can see a clear difference in number of posts per user on weekdays versus weekends. Users tend to post about 3 to 4 posts on weekdays and on weekends, they tend to post about 2 to 3. The average user is slightly less chatty because of the reduced number of users that contribute the community engagement.
- Looking at the blue bars, which indicate a high number of posts per user, there are two period of time where this happened. First was in end of 2014 and another was in early to mid 2018.
- In 2014, the users were probably excited about clearing their leaves and school year was going to end, so it was time for them to go on holiday or enjoy their down time.
- In 2018 though, it was a peculiar period. As indicated previously, this period of time experienced a high number of posts and a high number of users. So this prompts a question - what was happening back then that caused such a surge in activity?
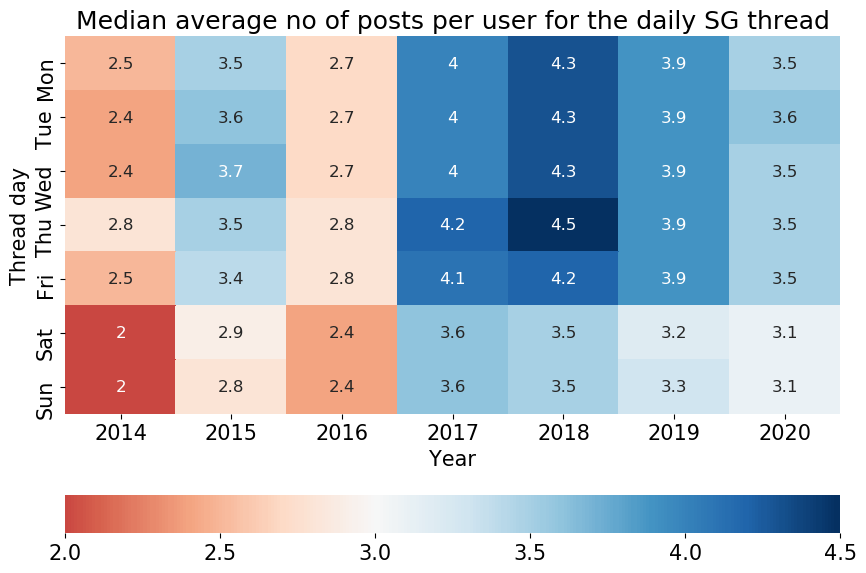
Looking at the heatmap above, the average user in 2020 has posted slightly fewer comments as compared to the median posts per user in 2017 to 2019. This is odd as I would have expected that circuit breaker would have increased the number of users and posts. I suppose that since non-essential workers were working from home for the entire circuit breaker and students were doing home based learning in the first half of circuit breaker and then they were on their June holiday in the second half, so their lives were less happening and they have fewer things to rant or talk about.
What about the hourly activity of the daily thread?
I decided to use the data for 2019 to calculate and plot the average hourly number of posts for each day of the week. The reason I chose 2019 data is because there doesn’t seem to have any outlier data and also because it is the most recent full year data that I have.
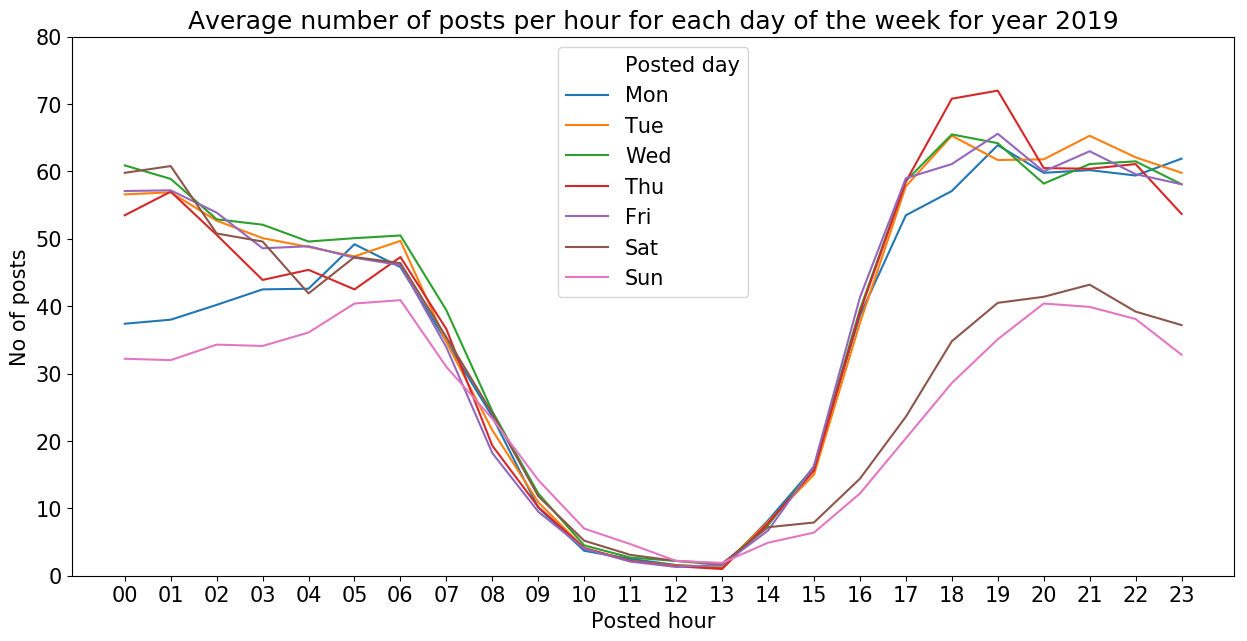
You can clearly is that there is an obvious trend regardless of the day of the week.
- From 6am all the way to 1pm, the number of comments posted is on a downhill trend.
- Starting from 1pm, the number of posts start to pick up. This is where the trend of weekday and weekend start to diverge.
The reason for the sudden drop in activity from 6am to 1pm is because 1. a new daily thread is posted and pinned, replacing the previous day thread and ending all discussions in the previous day thread, and 1. the users are preparing to go to work/school and are focusing on them first.
On weekdays, the number of comments posted would climb faster than it would on a weekend and it would reach it maximum at about 6-7pm. From there, it would very slowly decrease all the way to 6am. Then the cycle repeats.
The trend for the weekend is a little bit tricky to see. You would have to look at the end from 1pm of either Saturday or Sunday and connect the trend to the following day (Sunday or Monday) to see the actual trend and to ensure continuity. The number of posted comments on the weekend pick up slower and reach it peak at about 9pm. Then it would go down a little bit and from midnight onwards, it would go up to about 50 comments per hour at 6am before it goes downhill again.
One thing to note is that on Thursday between 4 to 7pm, the number of comments posted for each hour of the 3 hours time frame is significantly higher than the usual count for a weekday (70 comments vs 60 comments respectively). Is this because everyone is excited about TGIF the following day?
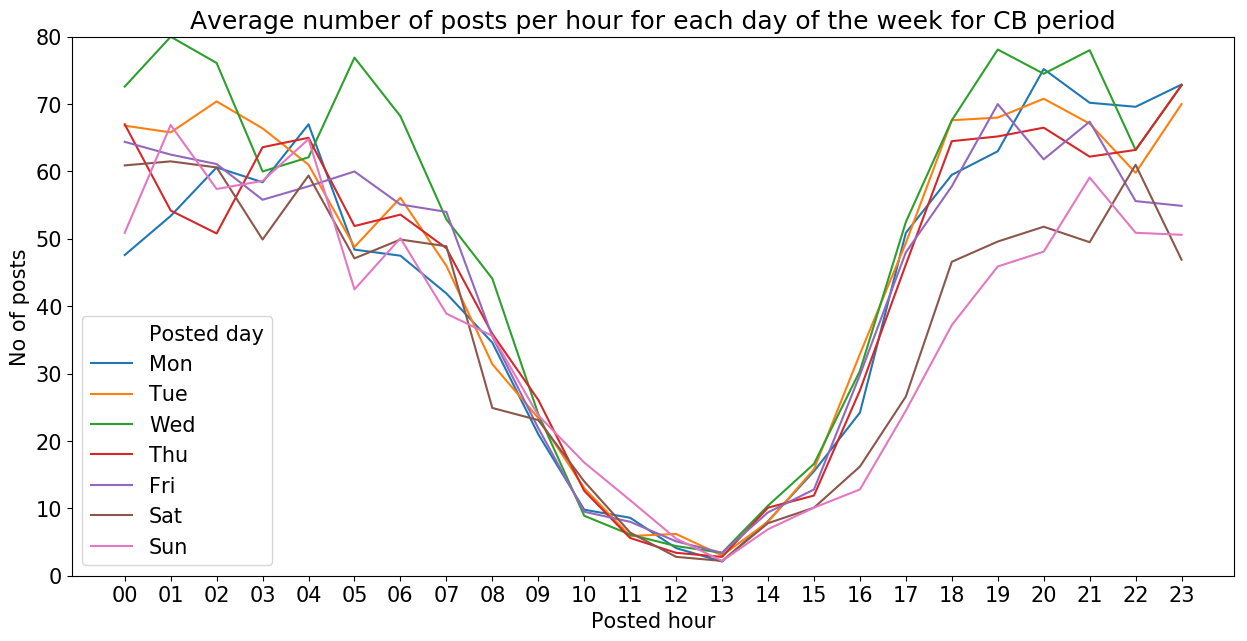
The shape is generally the same as last year’s average hourly comments. However, there are a few notable changes.
- There is almost no difference between weekdays and weekend comments especially in the first half of the day.
- Between 12 to 6am, there was a maximum difference of 20-30 comments for weekday versus weekend comments and it would slowly converge to about 50 comments at 6am.
- However, during the ciruit breaker, there is almost no difference. The second half of the day, there is still some difference but the difference between weekday and weekend comments are about 10 comments for each hour compared to last year’s difference of about 20 comments.
- The maximum hourly comments in the first half of the day tend to be lower than the second half of the day. However, that trend is no longer valid as the maximum for the first half and second half are the same, which is about 80 comments.
- Although the hourly comments at 6am is still about 50 comments, the decline in hourly comments have significantly slowed down. For example, in last year’s trend, the hourly comments at 8am was about 20 comments but during the circuit breaker period, the comments posted at 8am was nearly double of that (approximately 40 comments).
- The night activity would slowly die down after a certain hour last year. During circuit breaker, the hourly activity at night didn’t die down. Rather, it was stable and sometimes would increase.
All these differences show that circuit breaker has indeed changed the behaviour of the sg redditors. As they couldn’t go out and enjoy activities such as dating and shopping, more redditors have spent more time online and engaged with others within the community although the average redditor has posted fewer comments.
Conclusion
We could see how far the SGReddit community has grown from Jun 2014 to Jun 2020. It started off slow but it experienced exponential growth in 2017-2018 before reaching its steady state from 2019 onwards. Along with that growth is the number of posts per user as well. It has grew from 2-3 to 3-4 posts per user.
There is a clear distinction in the SGReddit activity on weekdays vs weekends throughout the year. This is very much likely due to the fact that the users are using Reddit during office hours on weekdays. Whereas on weekends, they are out enjoying their free time and thus spend less time on SGReddit.
However, there is change in behaviour when circuit breaker (CB) happened in 2020. There is a clear difference in the hourly number of posts pre-CB as we could see 2 distinct lines for weekdays and weekends. However, during CB, the distinct lines became more homogeneous especially between 12am to 12pm.